What Is Drawdown in Trading? Max Drawdown Explained
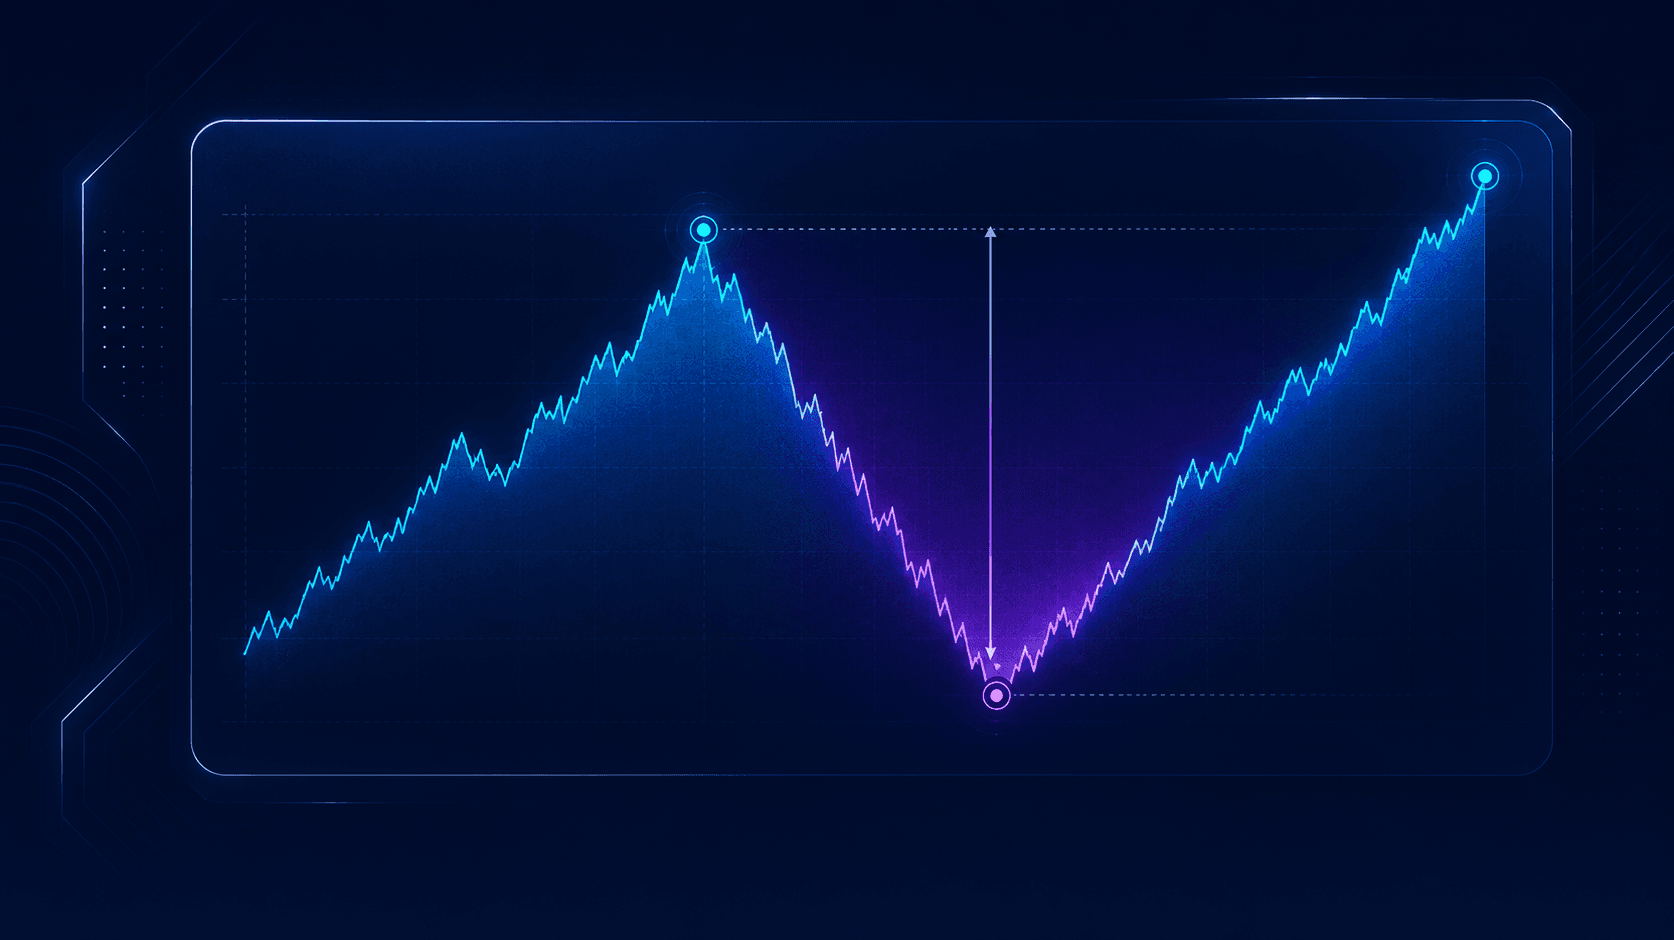
Drawdown in trading is the drop from a peak to a low point before a new peak is reached. Maximum drawdown is the largest of those drops on record.
If a strategy grows an account to $10,000, falls to $8,000, then eventually climbs higher, its maximum drawdown is 20%: the size of that worst peak-to-trough fall.
It answers the question that actually keeps people up at night: how bad did this get at its worst? Not on average, not usually, but at the single worst moment. That is the number you have to be able to survive, financially and emotionally, to stay in a strategy long enough for it to work.
Win rate, the number most products lead with, does not answer that question at all. Which is why drawdown deserves your attention first.
Why win rate is the wrong number to lead with
Win rate is the percentage of trades that end in profit. It feels like the obvious measure of quality. It is also easy to make look impressive while hiding real danger.
Here is the problem in one example. Imagine a strategy that wins 95% of its trades, each for a small gain, then loses 5% of the time for a catastrophic amount. The win rate is dazzling. The strategy is a time bomb.
This is not hypothetical in structure. It is the exact shape of many blow-up strategies: collect frequent small wins, and one bad event erases all of them and more. A 95% win rate with a 70% drawdown is a worse strategy than a 55% win rate with a 12% drawdown, and the win rate alone would tell you the opposite.
Win rate describes how often you win. Drawdown describes how much you can lose. Only one of those determines whether you get wiped out.
The recovery math nobody mentions
Here is the insight that reframes drawdown entirely, and it is pure arithmetic, not opinion.
Recovering from a loss requires a larger percentage gain than the loss itself, because you are now growing from a smaller base. The deeper the hole, the more brutally this asymmetry bites.
| Drawdown | Gain needed to recover |
|---|---|
| 10% | 11% |
| 20% | 25% |
| 30% | 43% |
| 50% | 100% |
| 70% | 233% |
| 90% | 900% |
Lose 50%, and you do not need 50% to get back. You need to double your money just to return to even.
The formula is simple enough to check yourself:
Recovery gain = drawdown / (1 - drawdown)
A 30% drawdown gives 0.30 / 0.70, which is 43%. A 90% drawdown gives 0.90 / 0.10, which is 900%.
This is why max drawdown is not a comfort metric, it is a survival metric. A 20% drawdown asks for a very achievable 25% recovery. A 70% drawdown demands you more than triple what remains, which for most strategies is not realistic in any reasonable timeframe. Two strategies with the same long-run logic can end in completely different places purely because one dug a hole it could climb out of and the other did not.
The lesson: shallow and steady usually beats spectacular and volatile, because the spectacular version can dig a hole the math will not let it escape.
How to read a drawdown figure honestly
A drawdown number on its own is incomplete. Three questions turn it into real information.
Over what period?
A 15% max drawdown over three months and a 15% max drawdown over three years are very different claims. The longer the observation window, the more market conditions it has survived, and the more the figure means. A short track record has simply not had time to meet its worst day yet.
In what market conditions?
A drawdown recorded only during a calm, rising market tells you little about how the strategy behaves in a crash. The most informative drawdowns come from periods that included real stress. Ask what the market was doing when the worst drop happened.
Backtest or live?
A max drawdown from a backtest can be optimised away by curve fitting: tuning the strategy until historical drawdowns look small on data the strategy was built against. A drawdown from live or forward paper trading, on data nobody had seen in advance, is far more trustworthy. Same number, completely different reliability.
Drawdown is also an emotional number
The financial math is only half the story. The other half is behavioural, and it is where most real losses actually originate.
Every strategy with an edge still has losing stretches. Drawdown is where people abandon a sound strategy at the worst possible moment, crystallising a temporary paper loss into a permanent real one by quitting at the bottom.
This is why knowing a strategy's maximum drawdown before you commit is so valuable. If a strategy's historical worst is 18% and you know that going in, an 18% dip is an expected event, not an emergency. If you did not know the number, the same dip feels like a failure, and you exit exactly when you should hold.
A practical test: look at a strategy's max drawdown and ask honestly whether you could watch your balance fall that far without interfering. If the answer is no, that strategy is wrong for you, regardless of how good its other numbers look. Matching drawdown to your own tolerance matters more than chasing the highest returns.
A worked comparison
Consider two strategies described only by the numbers a marketing page would show:
- Strategy A: 88% win rate
- Strategy B: 66% win rate
On win rate alone, A wins easily. Now add the number that was left out:
- Strategy A: 88% win rate, 47% max drawdown
- Strategy B: 66% win rate, 11% max drawdown
Strategy A's frequent small wins mask occasional deep losses. To recover from 47% down, it needs an 89% gain. Strategy B loses more often but never digs a hole it cannot climb out of, recovering from its worst point with a very manageable 12% gain.
For most people, especially beginners, B is the more survivable strategy, and survivability is what lets a strategy compound over time. The win rate pointed the wrong way. The drawdown pointed the right way. This is the entire argument in one example.
Drawdown vs volatility: not the same thing
These two get used interchangeably and they measure different things.
Volatility describes how much prices or returns move around, in both directions. High volatility means large swings up as well as down.
Drawdown measures only the downside, and only from a peak. It is the depth of the hole, not the size of the wobble.
A strategy can be volatile and still have a modest maximum drawdown, if its swings mostly resolve upward before compounding into a deep fall. Another can look calm on a volatility measure and still have taken one catastrophic drop.
Volatility tells you what holding the strategy feels like day to day. Drawdown tells you what the worst moment cost. For deciding whether you can survive a strategy, drawdown is the more direct answer.
How drawdown fits with other risk metrics
Max drawdown is the most important single risk number, but it works best alongside a few others:
- Win rate tells you how often trades succeed. Useful context, not a safety measure.
- Trade frequency tells you how active a strategy is, which shapes how often drawdowns can occur and how it feels to hold.
- Recovery time tells you how long the strategy historically took to climb back from its worst point. A shallow drawdown that lasts a year still tests your patience.
- Sharpe ratio measures return per unit of volatility. It rewards smooth returns, but because it treats upside and downside swings alike, a strategy can post a respectable Sharpe and still have suffered a severe drawdown.
- Risk tier bundles these into a category. Conservative strategies generally accept lower returns for shallower drawdowns; aggressive ones do the reverse.
Read together, these describe a strategy's temperament. Read in isolation, any one of them can mislead, and win rate is the one most often used to mislead on purpose.
Frequently Asked Questions
What is drawdown in trading? Drawdown is the fall from a peak in account value to a subsequent low, before a new peak is reached. It is expressed as a percentage and measures how far a strategy has fallen from its best point rather than how often it wins.
What is max drawdown? Maximum drawdown is the largest peak-to-trough fall a strategy has recorded. It represents the worst moment in its history and is the loss you would have needed to sit through without abandoning the strategy.
What is a good max drawdown? It depends on your risk tolerance, not on a universal number. Conservative strategies often target lower single-digit to low-double-digit drawdowns; higher-risk strategies accept more. The right maximum drawdown is one you could sit through without abandoning the strategy.
Is a lower max drawdown always better? Lower drawdown means lower risk, but usually alongside lower returns. The goal is not the lowest possible drawdown, it is a drawdown you can tolerate paired with a strategy whose logic is sound. An extremely low drawdown with no returns is not a win.
Why does recovering from a drawdown need a bigger percentage gain? Because you are growing from a smaller base after the loss. A 50% loss leaves you at half your money, so you need a 100% gain on that smaller amount to return to where you started. The formula is drawdown divided by one minus drawdown.
Is max drawdown more important than win rate? For assessing risk, yes. Win rate tells you how often a strategy wins but nothing about how much it can lose. A high win rate can coexist with a catastrophic drawdown. Max drawdown directly measures the worst case you would need to survive.
What is the difference between drawdown and volatility? Volatility measures how much returns move in both directions. Drawdown measures only the fall from a peak. A strategy can be volatile with a modest drawdown, or appear calm and still have taken one severe drop.
Can max drawdown predict future losses? No. It records the worst historical drop, not a ceiling on future ones. A future drawdown can exceed the historical maximum, especially in unprecedented conditions. Treat it as the worst seen so far, never as a guaranteed limit.